Discover a Powerful TapClicks Alternative
Whatagraph offers an easy-to-use platform to connect, organize, visualize, and share all your marketing data with excellent support and automation. Switch to a more intuitive TapClicks alternative with a straightforward UI and more time-saving features.
- 45+ marketing channels

- Live chat customer support
- Cross-channel reporting made easy
No credit card required


3 Reasons to Choose Whatagraph as Your TapClicks Alternative
Faster insights
Completing any action in TapClicks takes a lot of clicks, tabs, and screens to go through. For the time it takes to do or learn to achieve something in TapClicks, you could do much more work in Whatagraph.
One intuitive platform
TapClicks requires you to navigate multiple tabs and screens so much that it sometimes feels like working with multiple products instead of one intuitive platform. In Whatagraph, you can easily adjust data organization, add new sources, and set up sharing from one place.
Easier to visualize data
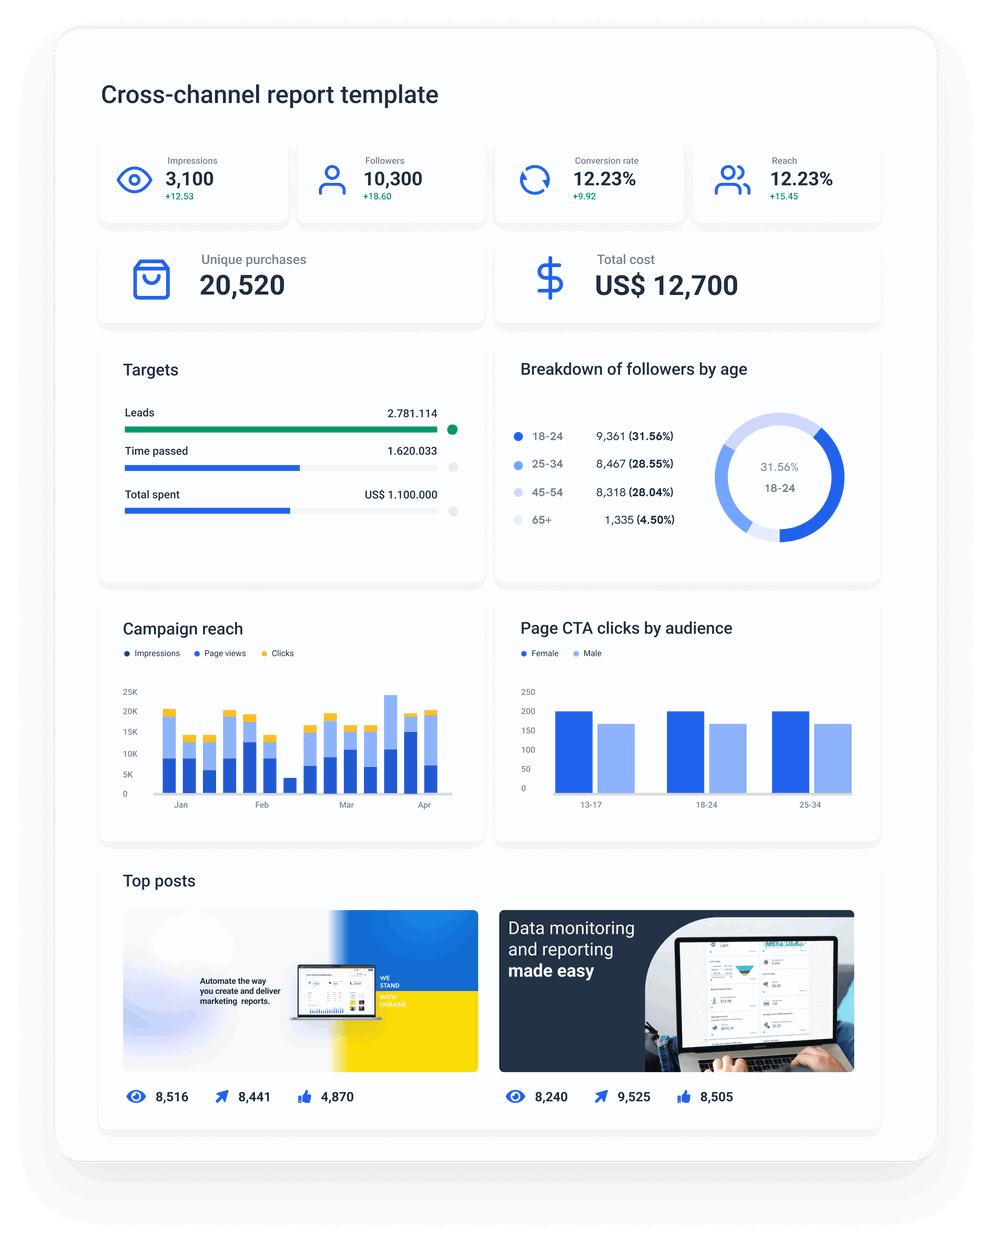
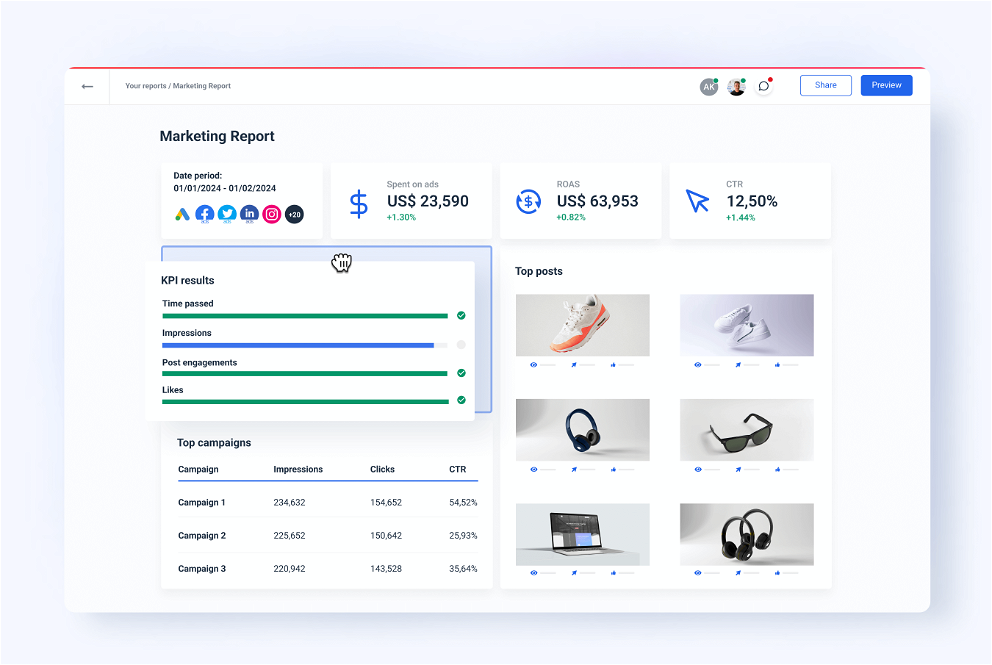
Whatagraph takes away all the hassle you go through visualizing data in TapClicks by introducing the intuitive drag-and-drop builder, libraries of pre-made widgets and templates, saving and reusing almost anything as a template, editing multiple reports in bulk, and cross-channel overviews.
A One-stop Shop Alternative to TapClicks
A single platform for all your marketing reporting needs. A worthy TapClicks competitor that is modern looking and easy-to-use.
| Connect | ||
| Integrations with popular marketing sources |  | |
| Native fully managed integrations | |  |
| Google Sheets and data warehouse integrations | | |
| Organize | ||
| Data organization capabilities | | |
| Custom formulas and markup calculations | | |
| Overall ease of use and intuitiveness | | |
| Visualize | ||
| Data visualization | | |
| Media widgets | | |
| Widget and report templates | | |
| Linked templates | | |
| Cross-channel overviews | | |
| Share | ||
| Sharing PDFs, sending out report emails or live links | | |
| Data export in spreadsheet format | | |
| Data transfer to a warehouse | | |
TapClicks Pros and Cons – What Do Users Say?
Working with TapClicks gives you access to a relevant and large integrations library for your marketing reporting needs. It is so great to know that you are just a few clicks away from creating and modifying cutting-edge dashboards to present to your clients.

Capterra verified review by
Jorge P. Digital Marketing Manager Marketing and Advertising, 51-200 employees
Linking new accounts can take 24 hours or more to populate data, it would be nice if this process was quicker. I would love to see more templates and reporting options on different data, specifically the ability to pull in audiences for display and video campaigns.

Capterra verified review by
Kim D. Digital Director Automotive, 11-50 employees
It is unable to pull KPI's out of custom data sets without manipulating the data and building a new report. Plus some very simple fixes that never get implemented like being able to pull a "count" from a data set by just counting rows that contain certain results in a field or being able to set a default date period on each dashboard.

Capterra verified review by
Jeff T. VP Strategic Partnerships Marketing and Advertising, 11-50 employees
We primarily use TapClicks as a connector for google data studio. This is a huge benefit to us in building out dashboards to get third party (non-google) data in. TapClicks has many connector options under their 250+ connector.

Capterra verified review by
Johnna P. Senior Analyst Legal Services, 1-10 employees
For some connections, namely Google Analytics, TapClicks is lacking because the store data in a Data Warehouse and siphon metrics into Data Views. We understand the reasoning, but it does lead to discrepancies in certain metrics, forcing us to pull from the native source for certain things.

Capterra verified review by
Carolyn M. Digital Marketing Specialist Marketing and Advertising, 1-10 employees
FAQs
All your questions answered. And if you can’t find it here, chat to our friendly team.
Is Whatagraph a reporting platform?
Yes, Whatagraph has an advanced reporting workflow, but it’s an all-inclusive platform you can use to connect data from multiple marketing sources, organize the data, visualize it in interactive dashboards or automated reports, and schedule report sharing with clients or stakeholders.
What integrations does Whatagraph support?
Whatagraph supports a range of integrations including web analytics tools like Google Analytics, social media like Facebook and TikTok, paid ads like LinkedIn Ads, and CRMs like HubSpot and Salesforce.
Does Whatagraph use third-party dashboards to visualize data?
No, Whatgraph does not use third-party dashboards to visualize data. While some of the competitors to TapClicks are mostly data integration platforms that depend on tools like Looker Studio for data visualization, Whatagraph is an all-in-one platform that natively connects, organizes, visualizes, and shares multi-source data in custom-built reports and dashboards.
What does TapClicks do?
The TapClicks product details from GetApp describe it as a platform with “end-to-end business intelligence capabilities that include SEO, social and PPC reporting, automated order entry, set up and approval workflows, marketing performance analysis and the creation of interactive visual reports and presentations.”
How does TapClicks pricing work?
TapClicks offers three packages with different advanced features. Each plan has the same choice of add-ons available, however, the specific price of either plan or add-ons is not disclosed on the website but is offered during the demo call based on the prospects’ needs.
Who is Whatagraph for?
Whatagraph is ideal for marketing agencies and businesses who struggle with any of these pain points:
- Clunky, slow, and overly complex tool stack. Things falling apart, connectors breaking off, need to transform data in one place, visualize in another. Data process needs managing and maintaining.
- Data chaos, siloed and scattered data from all the sources and campaigns. Lack of focus on what really matters - strategy and execution.
- It's tough to connect, aggregate, and organize all the data without an advanced skillset, tech knowledge, or involving data professionals. Hence, tough to uncover insights and see a holistic view of performance.
- Data visualization for analysis and reporting involves a lot of time and hassle, hard to set up, tough to get decent and clear visual results.
- Data processes eat up a lot of time and resources.
- Hard to scale the existing stack of tools for more clients or more campaigns.
- Data accuracy is an issue with existing stack of tools being unreliable. Low confidence in the data they have.
- Reports do not resonate with clients or stakeholders.
Are TapClicks reviews mainly positive or negative?
TapClicks reviews are mainly positive, with users praising the ability to pull data from many sources and the easy setup. As TapClicks disadvantages are concerned, most users mention discrepancies in metrics between the source and reports, as well as the platform taking longer time to refresh data.


Ready for insights?
It's time to focus your time on the tasks that really matter, and let us worry about your marketing analytics. Start your free 7-day trial.
- Free for 7 days
- No credit card required
- Live chat support
- Cancel anytime
No credit card required